Aspen Journalism is compiling a data dashboard highlighting metrics of local public interest, updated weekly.
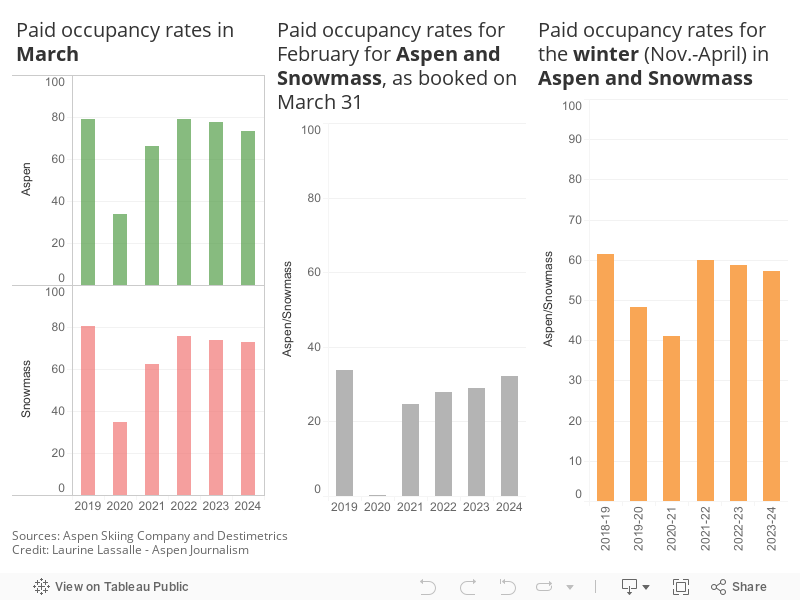
More rooms booked but overall occupancy down this winter
Paid occupancy in Aspen reached 73.5% in March, down from 77.8% last year. Snowmass recorded 72.7% paid occupancy, down from 2023’s 73.8%, according to the March 2024 occupancy report for Aspen and Snowmass lodges, compiled by local tourism officials and reservations tracking firm Destimetrics. March occupancy reached 73.1% for the two towns combined this year, down from 75.8% last year.
The report’s summary noted that due to increased available inventory, approximately 1.5% more rooms than last year were occupied in March.
After the 2021’s slow down due to the pandemic, March occupancy in Aspen peaked in 2022 as the it reached 79% that year while remaining lower than 2019’s 79.2%.
It’s worth nothing that only commercial occupancy is counted in the report. It doesn’t reflect the occupancy of short-term rentals.
April paid occupancy as of March 31 was at 32.3% for Aspen and Snowmass, up from 28.9% last year.
“Given the great skiing conditions and an extended season on Aspen Mountain, through 4/21, ideally, we will see a near record April,” according to the report.
Overall winter occupancy is down from last year with 57.1% of rooms booked for November through April for Aspen and Snowmass combined, down from 2022-23’s 58.7%, 2021-22’s 60% and from 2018-19’s 61.4% before COVID hit.
However, the report noted that 11,000 more room nights were sold this winter compared to last year.
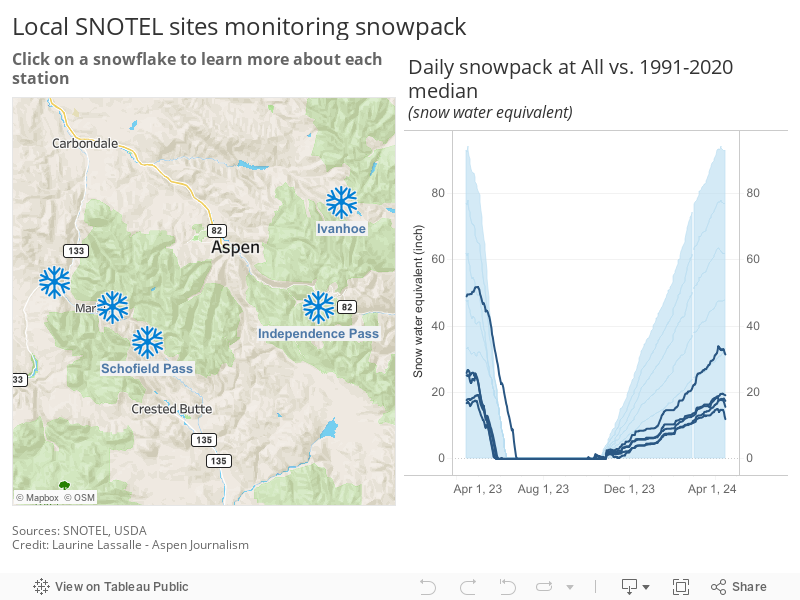
Snowpack starts melting as spring weather begins
Snowpack in the Roaring Fork basin started to drop this weekend as temperatures started to increase. Snowpack went from 17.7 inches of snow-water equivalent per site on April 12 to 16.4 inches on April 14, or 107% of median. That’s also down from 17.9 inches on April 7 and from 113% of median, according to NRCS.
SNOTEL sites that monitor snowfall throughout the winter measured the snowpack at Independence Pass at 108% of median on April 14 with a “snow water equivalent” (SWE) of 17.5 inches, down from 17.8 inches and 109.9% of normal on April 7. Last year on April 14, the SNOTEL station up the pass (located at elevation 10,600 feet) recorded an SWE of 16.8 inches.
The monitoring station at McClure Pass, located at elevation 8,770 feet, recorded a SWE of 12 inches on April 14 or 85% of median. That’s down from last week’s SWE of 14.7 inches. Last year, on April 14, the station measured a snowpack holding 25.9 inches of water.
On the northeast side of the Roaring Fork Basin, snowpack at Ivanhoe, which sits at an elevation of 10,400 feet, reached 19.2 inches of SWE on April 14, or 128% of median.
Snowpack at North Lost Trail, which sits at an elevation of 9,219 feet, has reached 15.7 inches of SWE on April 14, which is down from 17.8 inches on April 7.
Snowpack at Schofield Pass reached 31.5 inches on April 14, which represents 95% of median. That’s down from 33 inches on April 7. Schofield Pass sits at an elevation of 10,700 feet between Marble and Crested Butte.
Snow water equivalent — the metric used to track snowpack — is the amount of water contained within the snowpack, which will become our future water supply running in local rivers and streams.
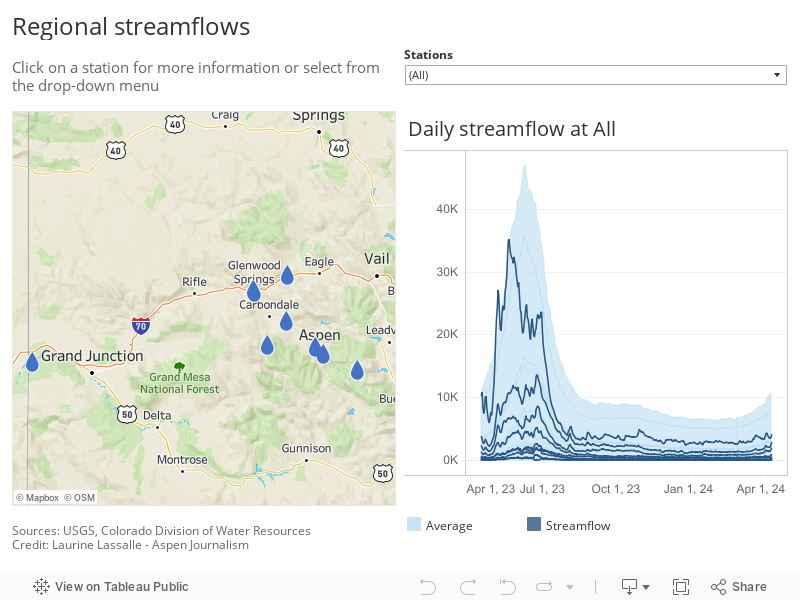
Spring runoff starts boosting streamflows
At Stillwater, located upstream of Aspen, the Roaring Fork River ran at 46.3 cfs on April 14, or 107.7% of average, up from last week when the river ran at 36 cfs and 72.5% of average.
Water through the tunnel that sends Roaring Fork flows east of the Continental Divide ran at 4.2 cfs on April 14.
The USGS sensor below Maroon Creek recorded the Fork running at 149 cfs on April 14, or 130.7% of average, up from 111 cfs and 92.8% of average, on April 7.
At Emma, below the confluence with the dam-controlled Fryingpan, the April 14 streamflow of 476 cfs represented about 123.6% of average. That’s up from 402 cfs on April 7 and from 118.9% of average.
Meanwhile, the Crystal River above Avalanche Creek, which is not impacted by dams or transbasin diversions, flowed at 258 cfs or 144.1% of average. Last week, the river ran at 91 cfs, or 73.6% of average.
The Colorado River ran at 2,800 cfs at Glenwood Springs, or 112.9% of average, on April 14, down from 2,090 cfs last week, while the Colorado flowed at 5,050 cfs near the Colorado-Utah stateline, or 79.8% of average.
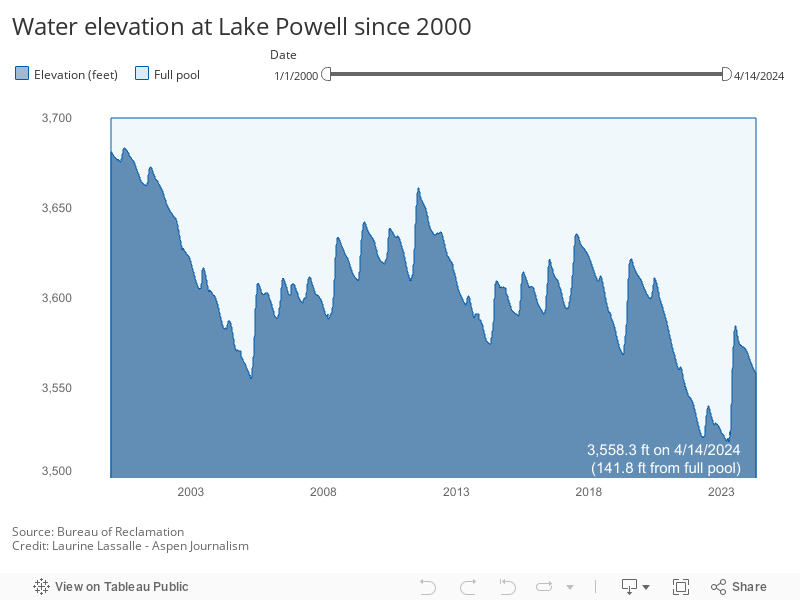
Lake Powell’s elevation down about four inches since last week
Lake Powell‘s water levels peaked in early July and are now decreasing. On April 14, the reservoir was 32.87% full (based on updated 2017-18 sedimentation data). That’s down from April 7 when the nation’s second-largest reservoir was at 32.97%.
On July 1, 2022, the Bureau of Reclamation revised its data on the amount of water stored in Lake Powell, with a new, lower tally taking into account a 4% drop in the reservoir’s total available capacity between 1986 and 2018 due to sedimentation. Aspen Journalism in July 2022 published a story explaining the that drop in storage due to sedimentation. We will be now using the 2017-18 sedimentation data only.
On April 14, 2023, the reservoir was 22.59% full.
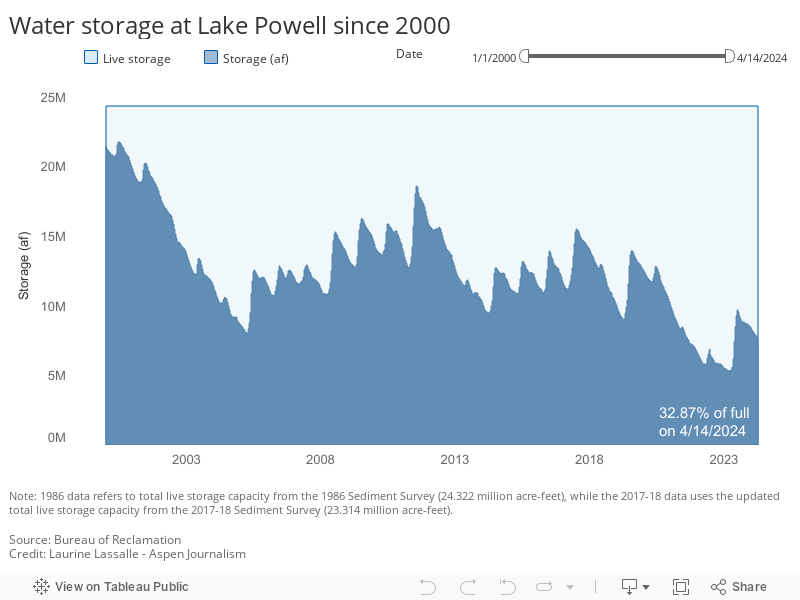
On April 14, Lake Powell’s elevation reached 3,558.3 feet, or 141.8 feet from full pool, which is down from 3,558.6 feet on April 7. Last year, on April 14 the reservoir reached 3,520.39 feet in elevation, or 179.61 feet from full pool.
The “minimum power pool” for turbines generating hydropower at the Glen Canyon Dam is 3,490 feet, and 3,525 feet has been set as a buffer to ensure that the reservoir and the turbines can continue to function properly.